Elastic pools make SQL cheaper and easier to run. They also hide the truth.
If your pool serves five apps and one of them goes wild, your bill goes up, but your cost report still says: "Elastic pool." That is not enough to drive accountability, decide what to fix, or explain spending to finance.
This guide gives you practical ways to allocate pool spend across databases or owning teams. Pick the option that matches how accurate you need to be, how much time you have, and how much political pain you can tolerate.
What Azure will and will not tell you
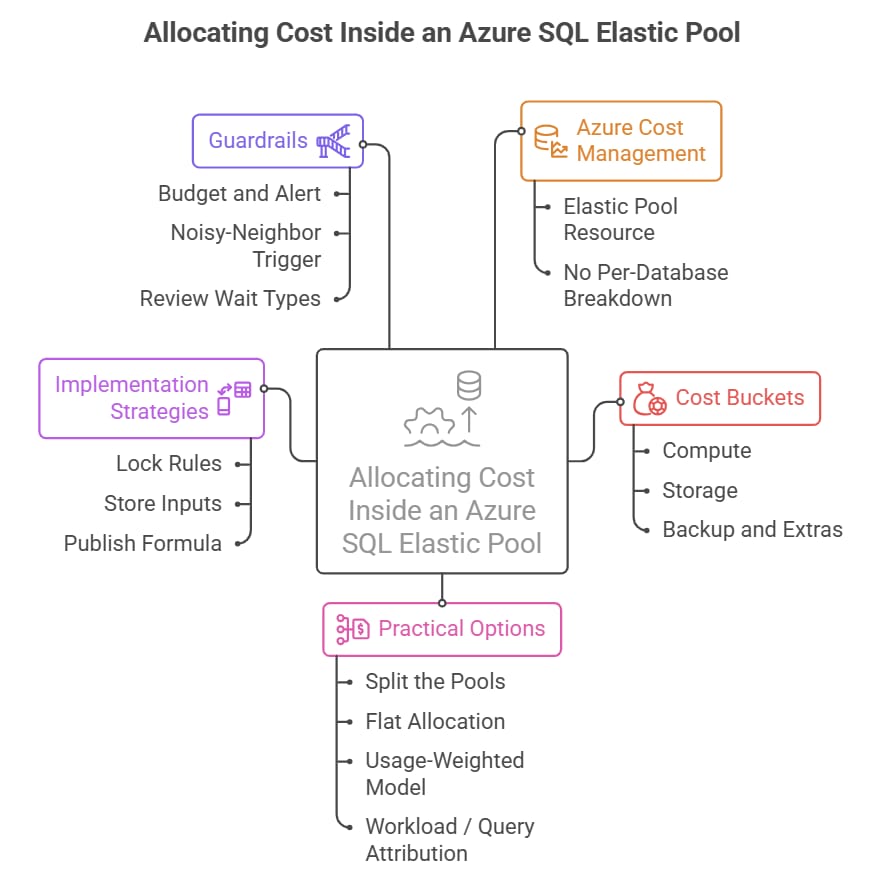
Azure Cost Management shows the cost of the elastic pool resource. It does not break that compute cost down per database inside the pool. This is normal: the pool is the billed unit for shared compute.
So, per-database allocation is an internal accounting exercise. You are building a model, not discovering a hidden invoice line item. That is fine, as long as you are transparent about how you calculate it and you keep the model consistent month to month.
What you are actually allocating
Most pool bills can be thought of as three buckets:
Compute: the pool's vCores or DTUs (shared across all databases).
Storage: data and log storage at the database level.
Backup and extras: backup storage, geo-replication, long-term retention, and any add-on features you enabled.
Compute is where the confusion lives, because it is shared. Storage is usually easier because you can measure it per database.
Decide what 'good enough' means
Before you pick a method, answer one question: are you trying to do showback (inform) or chargeback (bill)? Showback can tolerate rough edges. Chargeback needs consistency, documented assumptions, and agreement up front.
The four practical options
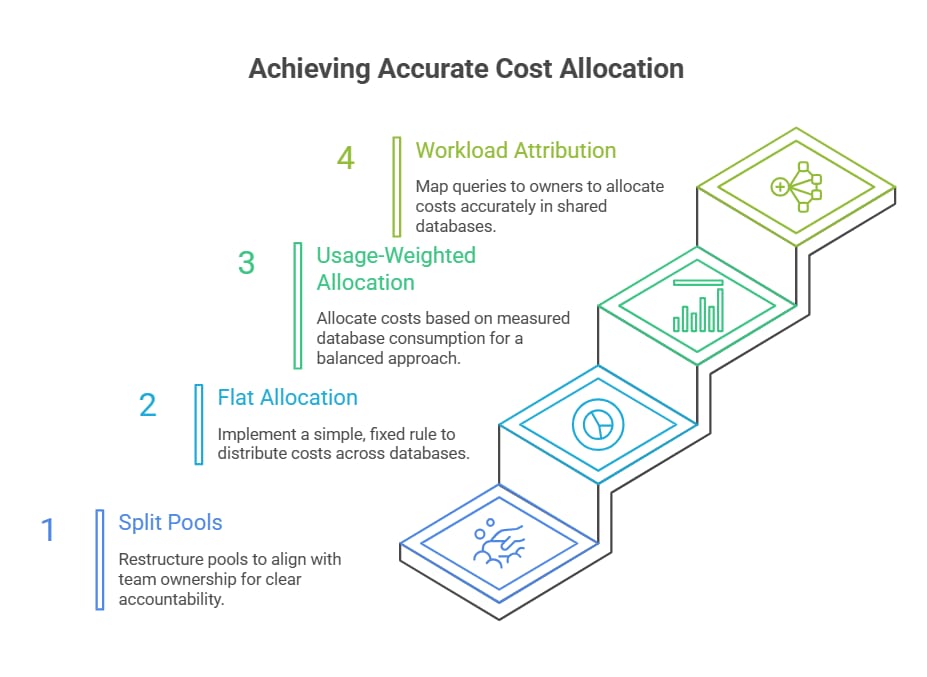
You have four approaches, from simplest to most precise. Most teams start at option 1 or 2, then evolve if the friction is worth it.
Option | Best for | Effort | Accuracy | What you get |
0. Split the pools | Clean ownership | Medium | High (org-level) | Costs map to teams by design |
1. Flat allocation | Fast showback | Low | Low to Medium | Simple % split that is easy to explain |
2. Usage-weighted model | Accountability | Medium | Medium | Per-db share based on measured usage |
3. Workload / query attribution | Deep chargeback | High | Medium to High | CPU and IO by workload, not just by DB |

Option 0: Split the pools (make ownership obvious)
If you can restructure, this is the highest ROI move. Put databases that belong to different teams into different pools. Then the billed unit matches your org chart. You can still share savings by tuning pool sizes and reservation strategy.
Use this when:
You have clear app ownership but messy pooling.
One or two databases are noisy neighbors that distort spending for everyone else.
You are tired of arguing about allocation models.
Watch outs:
You may need to re-test performance because pool contention changes.
More pools mean more resources to govern (alerts, budgets, scaling).
If some pools are tiny, unit economics can worsen.
Option 1: Flat allocation (quick showback that creates accountability)
This is the simplest model: decide how to split the pool cost across the databases (or owning teams) using a fixed rule.
Common flat rules:
Equal split: every database gets the same share.
Owner split: split by team and then divide within the team.
Tier split: classify databases into Small, Medium, Large, and assign fixed weights (for example 1, 2, 4)
Flat allocation is not about precision. It is about getting the conversation started: who owns what, what matters, and what needs attention.
Option 2: Usage-weighted allocation (good balance of effort and signal)
Here, you split the pool compute cost based on each database's measured consumption over the month. You will not get perfect accuracy, but you will get a defensible signal.
A practical weighting model
Pick a few metrics that roughly represent what drives your pool cost. Then compute each database's share.
Compute share: average dtu_consumption_percent (DTU model) or CPU usage percent (vCore model metrics).
IO share: log write percent or data IO percent if you see IO-driven contention.
Storage share: average data + log GB for the month (and backup/LTR if applicable).
Example formula
ComputeShare = Normalize(ComputeMetric)
IOShare = Normalize(IOMetric)
StorageShare = Normalize(StorageGB)
AllocationWeight = 0.60 ComputeShare + 0.20 IOShare + 0.20 StorageShare
AllocatedCost = PoolMonthlyCost AllocationWeight
The weights are not magic. Choose them based on what actually drives your bill. If storage dominates, weight storage more.
How to implement it in a way that survives audits
Lock the rules for a quarter at a time. Do not change weights every month.
Store the model inputs (metrics export) so you can reproduce the numbers later.
Publish the formula and the assumptions with the report.
Option 3: Workload or query attribution (when teams share a database)
Sometimes multiple apps share one database. In that case, per-database allocation is not enough. You need workload attribution.
The usual move is Query Store: identify top queries by CPU, duration, and reads, then map those queries to a workload owner (schema, login, application name, or a naming convention). You then allocate a database's share across workloads.
Use this when:
One shared database supports multiple business units.
You are doing internal chargeback and need the argument to hold up.
You are willing to invest in instrumentation and governance.
Watch outs:
Mapping queries to owners can be political and messy.
You need consistent client identification (application name, logins, or tags in the app connection string).
It is easy to build a model nobody trusts. Keep it simple.

The 15-minute quick start (good enough for next month)
Export last month's elastic pool cost from Cost Management (pool resource only).
List databases in the pool and assign an owner (team, app, cost center).
Pull two metrics for the same time range: a compute metric (DTU or CPU) and average storage GB.
Compute weights per database and multiply by the pool cost.
Publish the report with a one-paragraph disclaimer: this is an allocation model based on measured usage, not invoice line items.
Guardrails so the pool does not surprise you
Budget and alert at the pool level. Even if you do per-db allocation, the pool is still the blast radius.
Set a noisy-neighbor trigger: if one database exceeds a usage threshold for N hours, investigate or isolate it.
Review top wait types and Query Store top consumers monthly. If one workload is trending up, you want to know before the bill does.
Closing thought
If you cannot explain where your SQL spend goes, you cannot manage it. Start with a simple model, make it consistent, and use the results to drive better pool design and better behavior.
