Elastic pools are supposed to make Azure SQL cheaper and easier. They often do. But they also create a visibility problem that quietly breaks FinOps, performance triage, and accountability.
Here’s the uncomfortable part: an elastic pool gives you a single bill for a shared resource, but your reality is many databases, many owners, and wildly different usage patterns. That mismatch is where bad decisions come from.
The one insight
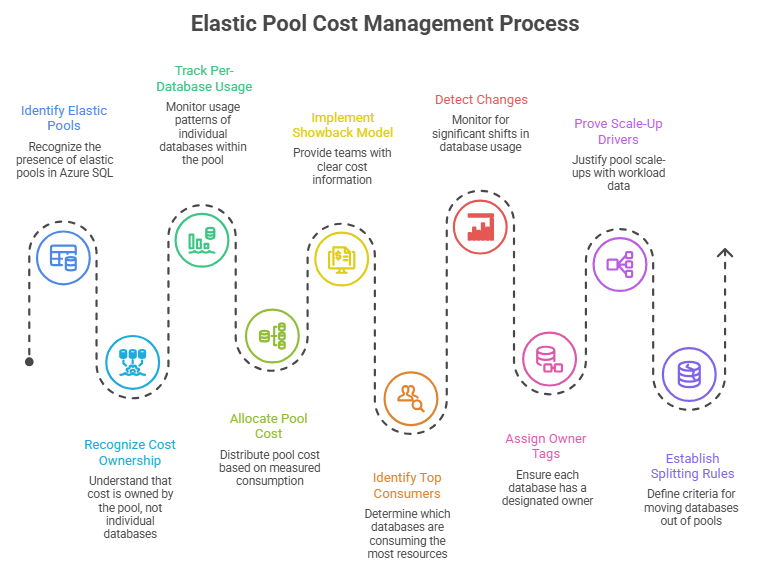
In an elastic pool, cost is owned by the pool, not by the database.
That sounds obvious, but most teams still talk about “the cost of database X” as if Azure meters it that way. It doesn’t. Azure meters the pool. Your databases compete inside it.
So if you only look at cost data, you will miss the real story. The story lives in consumption.
Why it matters
Three common failure modes show up when you treat a pool like a neat, tidy set of per-database costs:
1) Showback turns into a guessing game
If finance asks, “Which app is driving the spend increase?” the honest answer is often, “We can’t tell from billing.” Teams then do one of two things: they split pool cost evenly across databases, or they charge it all to the loudest team in the room.
Both are wrong. Even splits punish low-usage apps. Blame-based allocation creates politics.
2) Right-sizing decisions get distorted
Pools are great at smoothing normal variance. They are bad at hiding runaway behavior.
One database with a query regression, a missing index, or a bursty workload can force a pool scale-up. Now every database is “more expensive,” and nobody can explain why.
That is how pools quietly inflate over time: one spike leads to a new baseline. The pool never comes back down.
3) Noisy neighbors become invisible
Elastic pools share CPU and IO. If one database is hogging the budget, other databases feel it as latency, timeouts, and user pain.
The problem is that you can look at the pool and see it is hot, but you still need to know which database is causing the heat. If you do not have per-database signals, triage turns into trial-and-error.
What a better operating model looks like
Treat the pool as the billing container, and treat the databases as consumers. That means you track per-database usage and allocate pool cost based on measured consumption, not guesses.
You do not need a perfect model on day one. You need a model that is explainable, repeatable, and good enough to drive action.
A simple allocation model that teams can live with
Here is a practical starting point for a monthly showback model:
Pool baseline cost: 100% of the pool’s compute and storage spend for the month.
Storage share: allocate pool storage cost by each database’s average data + log size.
Compute share: allocate pool compute cost by each database’s average DTU consumption percent (DTU pools) or CPU + IO signals (vCore pools).
Smoothing: use 7-day or 30-day averages to avoid one bad afternoon dominating the month.
Guardrail: if one database consumes more than 50% of the pool for multiple days, treat it as a candidate to split out.
Is this perfect accounting? No. But it produces a truth your teams can work with: which databases are consistently heavy, which are light, and which changed.
How to get the signals
You have two places to pull per-database signals: Azure Monitor metrics and SQL-side telemetry.
What you pick depends on your tooling, but the goal is the same: a monthly view and a daily triage view.
Azure Monitor (good for dashboards and alerts)
Per-database metrics like DTU consumption percent, CPU percent, and storage percent (depending on your tier and configuration).
Pool-level metrics to know when the shared budget is running hot.
Alerting for sustained high consumption, not just one spike.
SQL-side telemetry (good for attribution and root cause)
sys.dm_db_resource_stats for a rolling view of CPU, data IO, log IO, and memory usage.
Query Store to spot regressions and top queries when one database goes sideways.
Wait stats and query duration trends to connect pool pressure to user impact.
If you already centralize telemetry in Log Analytics, this becomes even easier: you can build a pool report that shows the top databases by sustained consumption and the week-over-week change.
The checklist
If you run Azure SQL elastic pools, ask yourself these questions. If you cannot answer them in minutes, you are flying blind:
Which database is the top consumer in each pool this week?
Which database changed the most compared to last month?
Do we have owner tags for every database, not just the pool?
Can we prove that a pool scale-up was driven by one workload vs broad growth?
Do we have a rule for when to split a database out of a pool?

A practical next move
Pick one pool. Build a simple “pool truth table” for the last 30 days: database name, app owner, average consumption, storage size, and a rough cost share.
Then do the only thing that matters: act on it. Move the true outliers to their own pools, tune the worst queries, and stop spreading the bill evenly across everyone.
If you want the Azure Elastic Pools Hidden Truths Investigation Pack you get get it here 👉 https://tally.so/r/RGP6bl.